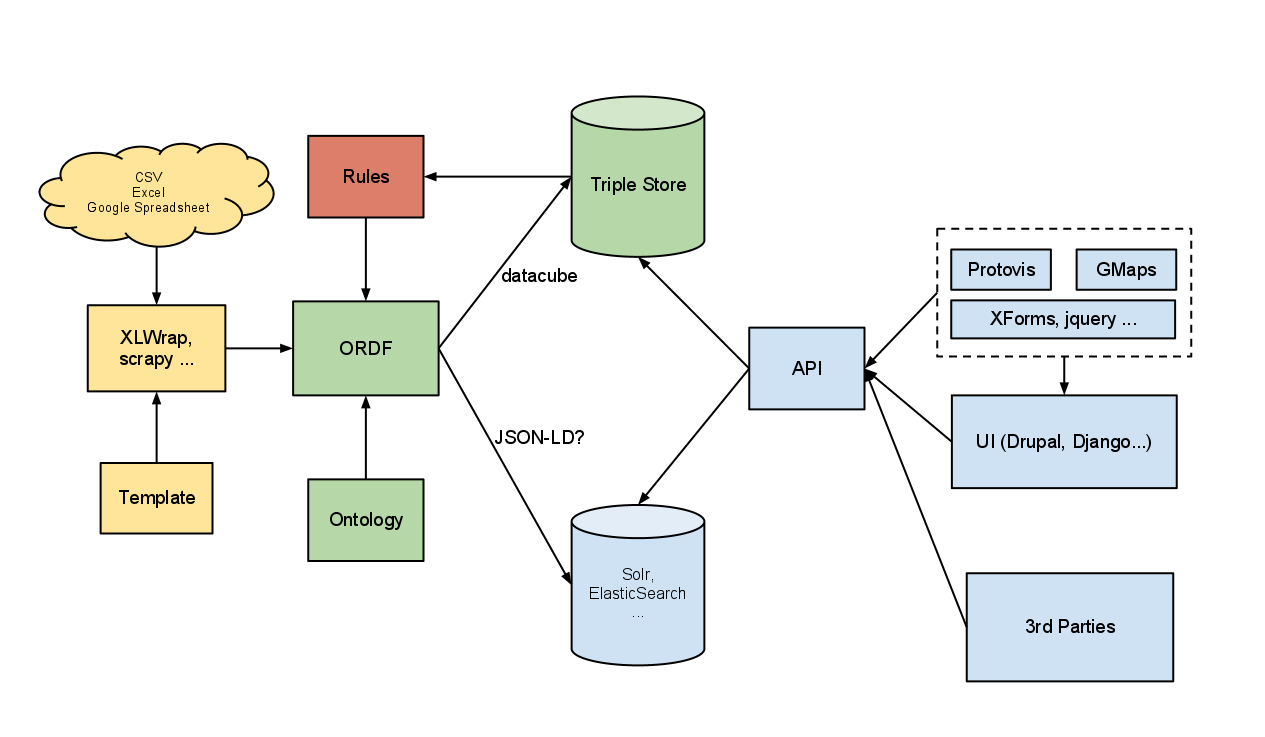
Linked Data Platform Architecture mk. II
Since it’s inception as a re-usable toolkit fed from the work we have been doing with the NHS National Innovation Centre, the Linked Data Platform has evolved. The core functionality is still focussed on taking data from spreadsheets and other structured sources (including SPARQL endpoints) and then visualising this data within a Drupal-based UI. However, we’ve learnt a lot along the way and are currently planning and implementing changes in the technology and architecture we use to pursue this goal.

The above diagram depicts the architecture we’re working towards. I’ll explain a little about the main changes below:
Loosely-Coupled Services
Moving away from the traditional page-based request-response model, where most of the application logic is implemented on the server, towards a more flexible architecture that should leave us less dependant on any one technology. As we introduce smarter data stores, such as ElasticSearch, combined with smarter clients using modern js frameworks, we’re finding there’s less for the Drupal layer to do, and indeed it can sometimes get in the way. We’d like to see more of the following:
- Client requests data objects directly from data store / API layer
- XForms or similar used to represent data objects and widgets in the browser
- Support for pluggable visualisation layer
- We build on our own API, which calls our loosely coupled services.
Adopting datacube as a model
I’ve written before about how powerful and flexible datacube is as a way of modelling statistical data. We’ve found that the datacube model of statistical data being a set of “observations” really applies throughout our architecture, from RDF right up to the UI.
Data-driven UI
The goal is a UI for exploring, slicing, and visualising statistical data. The UI’s structure and content should be driven by the data (stored as RDF datacube), along with an ontology. Clearly there will application code responsible for rendering the UI, but the rendering methods will be selected based upon properties of the data itself and rules defined in our ontology. Facets, or similar, will be present in the UI to allow the user to find data, filter data, and select related data. It would be also advantageous to be able to perform statistical operations across multiple data slices, such as aggregate, average, standard deviation.

A great example of a dynamic UI that I take inspiration from here is the ElasticLists demo for Nobel Peace Prize winners. The principle of a responsive UI for filtering data is well executed here, our UI should take this principle and apply it to visualising statistical data.
It may be desirable to reflect the concept of an OLAP cube in the UI, and allow certain OLAP operations, such as slice / dice / drill-down.
Use ElasticSearch to drive UI
ElasticSearch is basically a inverted index based on Lucene, similar to Solr. It’s main advantages are that it’s schema-less, can store nested json documents rather than flat XML, and it has some funky auto-scaling features. We intend to use it as noSQL storage with a powerful query engine, to drive our UI.
In our previous architecture we were driving the UI directly from the triple store, this caused a number of problems: The triple store is slow, complex queries are very, very slow, aggregates are not supported in SPARQL 1.0, and neither are any statistical operations. ElasticSearch addresses all these problems, it’s blazingly fast, we can use facets for aggregation and there’s also a statistics library that may allow us to do statistical operations over slices of our data in real time. This great blog post on driving Protovis visualisations from ElasticSearch queries is what really sold us!
ORDF - Uniting our data
Now that we’ve introduced ElasticSearch to drive the UI, we need some way to ensure data integrity and synchronisation with the triple store. We still want to maintain the triple store, as it’s the best place for us to do inference, link up with other data sources, and we can also open up a SPARQL endpoint to the world. We’re looking at using ORDF - a python library from the Open Knowledge Foundation as a front end to our data stores, it should allow us to do the following:
-
CRUD sync - rules will describe how to map and transform data for storage in our back-ends (Virtuoso and ElasticSearch).
-
Provenance - track revision information and store alongside the data.
ORDF does not currently support ElasticSearch as a back-end, but it supports Xapian, and as ElasticSearch is schema-less and allows you to send it any json document, it should be trivial to add support.
Clearly there is a fundamental difference in the data models of RDF and ElasticSearch, one stores graph and the other flat documents. We see this as the job of our ontology to describe how ORDF should flatten out data to be stored in ElasticSearch. At the moment we seem to be getting quite a lot of milage by simply storing each datacube Observation as a document, with fields for the measures and dimensions. This allows us to present facets for each dimension, allowing us to filter our data down by fixing dimensions, akin to the OLAP cube’s slice operation.
I’ll be writing more about each of these topics over the coming weeks, as we begin to implement them. Please do leave a comment if there’s anything in particular you’d like to hear more about!